

After the Buildout
Reading the IEA Global Energy Review 2026 beyond the headline


The margin is cleaner. The base is not.
The most useful way to read the IEA Global Energy Review 2026 is not as a victory lap, but as a change in the shape of the problem. Global energy demand grew by 1.3% in 2025, slower than in 2024. Solar PV was the largest single contributor to incremental global energy demand, and low-emissions sources together contributed nearly 60% of total demand growth. That is a meaningful shift. Clean technologies are no longer a decorative part of the energy balance; they are visibly affecting the margin.
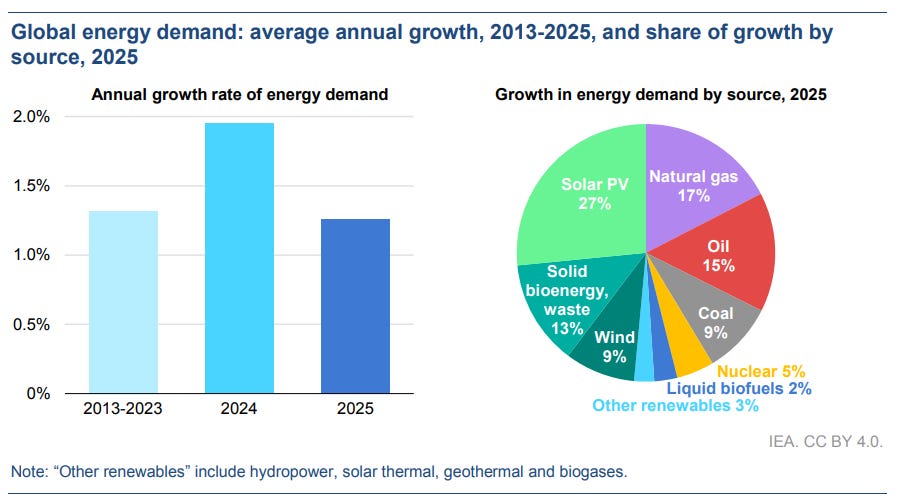
But that does not mean the fossil system is being displaced cleanly or uniformly. The same IEA review says oil, natural gas and coal demand all grew in 2025, albeit more slowly than in 2024. The distinction matters. Meeting a large share of incremental demand is not the same thing as reducing the existing fossil stock. It means the next layer of growth is becoming cleaner, while much of the installed system remains fossil-based.
This is also where caution is needed with displacement language. In an annual global report, we cannot observe a simple one-for-one substitution where every new solar MWh cleanly removes a specific coal or gas MWh. Dispatch, demand growth, weather, hydro conditions, nuclear availability, fuel prices, curtailment and grid constraints all affect what actually gets backed down. The IEA’s direction of travel is credible, but the language should be treated as system-level contribution, not mechanical replacement.
The transition is now strong enough to shape the margin. It is not yet strong enough to make the fossil base disappear.
Solar has moved the bottleneck
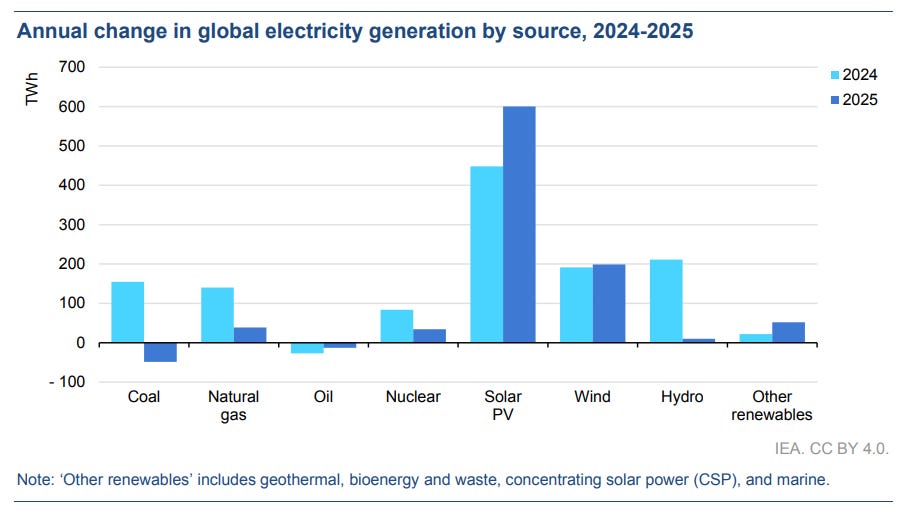
Solar PV is the report’s obvious headline. The IEA estimates that solar generation rose by around 600 TWh in 2025, the largest annual increase ever recorded for any electricity source outside post-crisis rebound years. It also says solar alone met around 70% of global electricity generation growth. Ember’s own global electricity review broadly reinforces the power-sector direction, finding that renewables overtook coal in the global electricity mix in 2025 and that solar posted record growth.
That does not make solar a finished story. It makes solar a system story. The IEA reports record renewable capacity additions of around 800 GW, with solar providing about three-quarters of the total. China alone added nearly 370 GW of solar PV and 117 GW of wind. At that scale, the constraint increasingly shifts from the cost of modules to the ability of grids and markets to absorb the output.
A better way to read this is that solar has solved one problem and exposed the next. Cheap generation is not the same as useful generation. A solar project still needs a connection, an offtake route, a market structure, a profile value, and enough flexibility around it to prevent the value of its own output from being cannibalised. The IEA itself notes that renewable expansion is taking place despite grid-connection delays, supply-chain strains, financial pressures and policy shifts.
This is where the investment lens becomes more interesting than the capacity chart. If modules are abundant, the scarce asset is not necessarily the panel. It may be the grid slot, the land position, the permit, the storage pairing, the contracted offtake, or the ability to inject power when the system actually needs it.
Solar is no longer just a cost curve. It is a test of whether power systems can digest abundance.
Electrification shifts the burden onto infrastructure
The IEA argues that 2025 confirmed the “Age of Electricity”. Global electricity demand grew by around 3%, more than twice the rate of overall energy demand, adding roughly 800 TWh. Buildings, industry, appliances, EVs and data centres all contributed. In the United States, data centres accounted for around half of electricity-demand growth.
The usual reading is that this is good for decarbonisation because more end uses can be served by cleaner power. That is directionally true, but incomplete. Electrification also moves the centre of gravity of the transition onto networks, substations, transformers, connection queues, capacity adequacy, planning systems and consumer bills. The power system becomes the bottleneck through which more of the economy must pass.
This is not just a technology question. It is a balance-sheet question. Fuel-cost exposure can decline in some places, but the system may replace it with long-duration infrastructure commitments: grids, storage, balancing, firm capacity, interconnectors, and capacity payments. That is not an argument against electrification. It is an argument against pretending the cost simply vanishes because the fuel input changes.
Data centres are a good example. Globally, they are still not the whole electricity-demand story. Locally, they can be large enough to shape connection queues, procurement strategies and grid-reinforcement needs. A data centre does not stress the global average. It stresses the substation.
Fossil fuels are changing job description
The fossil fuel story in the IEA review is slower growth, not collapse. Oil demand increased by 0.65 mb/d, gas demand rose by around 1%, and coal demand grew by around 0.4%. Those are not explosive numbers, but they are still positive. The Global Carbon Project also projected a record year for fossil CO2 emissions in 2025, with fossil emissions rising by around 1.1%, although its scope and timing differ from the IEA’s energy-related CO2 estimate.
The important shift is functional. Fossil fuels are losing some of their easier growth markets, but they remain embedded in harder-to-displace roles. Oil demand growth is increasingly tied to petrochemicals and aviation rather than road transport. Gas remains tied to heating, industrial use and flexible power generation. Coal weakens in some systems, but still reappears when gas prices rise or security politics harden.
The oil section makes this clear. The IEA notes that road-fuel demand in advanced economies was broadly flat as efficiency, hybrids and electrification offset activity growth. In China, gasoline and diesel demand were virtually unchanged despite reported GDP growth, while petrochemical feedstock demand accounted for almost all of China’s oil-demand increase. That is not a simple “fossils are over” story. It is a story about where fossil demand becomes stickier.
Gas shows the same pattern. The IEA says buildings became the largest driver of gas-demand growth in 2025 because colder weather lifted heating needs. In Europe, weaker wind and hydro output pushed gas use higher in power generation even as high gas prices weighed on industry. Gas is not just a transition fuel in a slogan. It is also the fuel the system reaches for when weather, flexibility and reliability collide.
The easy fossil demand is being attacked. The sticky fossil demand remains.
Emissions language needs caution
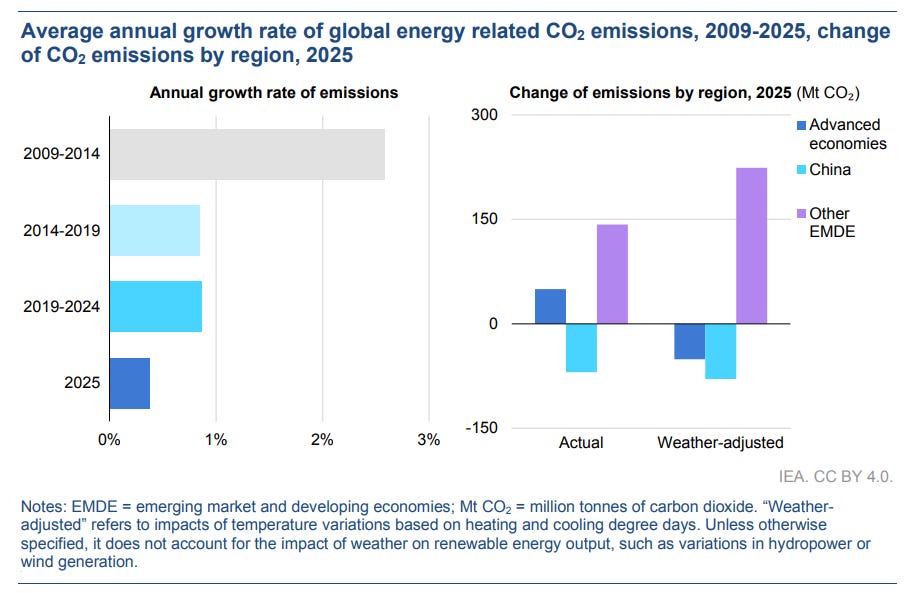
This is the section where the rhetoric should be most disciplined. The IEA says global energy-related CO2 emissions rose by around 0.4% in 2025, reaching a new high of nearly 38.4 Gt. The Global Carbon Project, using a different but overlapping fossil-carbon accounting frame, projected fossil CO2 emissions at around 38.1 Gt in 2025 and also at a record high. The two numbers are not identical because the scopes, timing and methodologies differ, but the basic direction is consistent: emissions did not fall globally.
The IEA also estimates that clean technologies deployed since 2019 avoided more than 35 EJ of annual fossil-fuel demand and around 3 Gt of CO2 emissions annually. That is an important modelling result, but it should be described carefully. “Avoided” emissions are counterfactual estimates. They depend on assumptions about what would have happened without the clean technology deployment: what plants would have run, what vehicles would have been sold, what heating systems would have been installed, and how demand would have been met.
Counterfactual estimates are still useful. Energy modelling has to ask what demand and emissions might have looked like under a different technology mix.
A fair reading is that clean technology deployment is changing the shape of fossil demand, rather than removing the fossil system evenly. It can reduce fuel burn in some sectors and periods, especially where renewables displace generation or EVs reduce road-fuel use. But firm demand, heating needs, industrial use and security margins remain more stubborn, and in stressed conditions they can still pull gas or coal back into the mix.
Clean technologies are bending the system. The harder test is whether that translates into durable reductions in absolute fossil demand, measured emissions, reliability risk and total system cost.
That is the distinction worth keeping. The counterfactual helps explain direction. The observed system shows how much of that direction has actually converted into structural displacement.
China is building transition and insurance at the same time
China remains the decisive swing factor. The IEA says China’s energy-demand growth slowed to 1.7%, while rapid renewables and nuclear growth helped push down coal use in electricity generation. It also estimates that China’s emissions fell by around 0.5%, helped by renewables, slower energy-intensive industry and electric vehicles.
But China is not running a tidy substitution model. It is building clean capacity and energy-security insurance at the same time. The IEA notes that China commissioned almost 80 GW of coal power plants in 2025, following a wave of approvals after the 2021 power shortages. The report frames much of this as capacity intended to meet peak demand and support energy-security goals.
That matters because it says something about how serious energy strategy actually behaves. China is not choosing between clean deployment and optionality. It is buying both. Solar, wind, nuclear, batteries, grids, coal capacity and domestic industrial supply chains are all part of the portfolio.
Western commentary often tries to force China into either “green leader” or “coal villain”. The more useful reading is that China is building the future energy system while retaining a large insurance layer from the old one. That may be inelegant, but it is strategically coherent.
Advanced economies are lower-fossil, not post-fossil
One of the more awkward IEA findings is that emissions from advanced economies grew faster than those from emerging and developing economies for the first time since the 1990s. Advanced-economy emissions rose by 0.5%, driven by colder weather, higher gas consumption and gas-to-coal switching in the United States.
The point is not that the long-term trend has reversed. It is that advanced economies are not post-fossil systems. They are lower-fossil systems under normal conditions, but their emissions profile still responds to weather, fuel spreads, hydro availability, wind output, peak demand and backup requirements.
The United States shows one version of the issue. Strong electricity demand, higher gas prices and slower coal retirements pushed coal-fired generation higher. Europe shows another. Solar output reached new highs, but weaker wind and hydro still left more room for gas-fired generation.
This is a system-completeness issue. Average annual clean generation does not tell you how the system behaves at the margin. A power system can reduce fossil generation across the year and still lean on fossil capacity when demand rises, renewable output is weak, or dispatchable capacity becomes scarce.
That is the harder benchmark for advanced economies now: not headline clean generation shares, but whether lower fossil dependence holds under adverse operating conditions.
Weather is not a footnote
The 2025 energy story is impossible to read properly without weather. The IEA repeatedly points to lower cooling demand after the extreme heat of 2024, colder winters in advanced economies, weak hydro and wind in parts of Europe, and India’s early and strong monsoon. These were not small footnotes; they materially changed fuel demand, electricity demand and emissions.
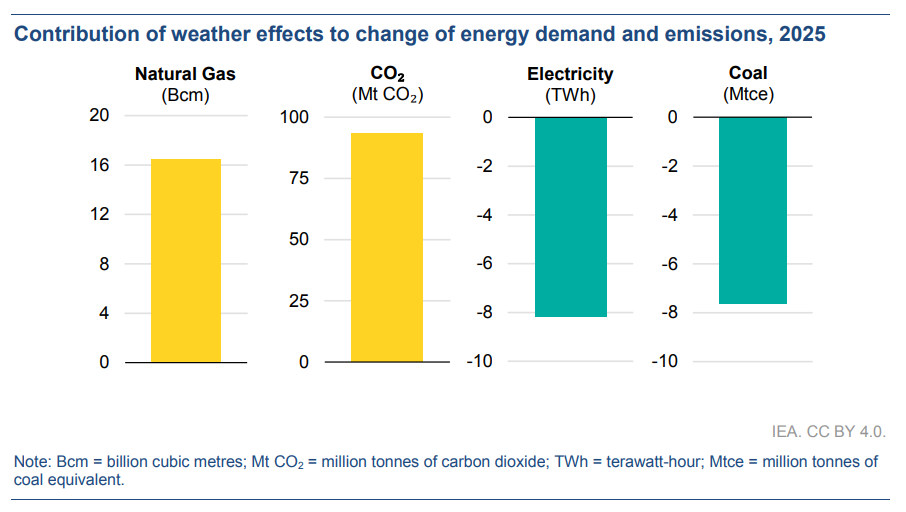
The IEA estimates that weather-related factors, including temperature variations and shortfalls in hydropower and wind, pushed fossil-fuel combustion emissions up by around 90 Mt CO2 in 2025. At the same time, India’s emissions outcome was helped by monsoon conditions that lowered cooling demand and boosted hydro.
That should make everyone more cautious with annual narratives. A good monsoon can make India look cleaner. A cold winter and weak renewables output can make advanced economies look dirtier. Neither should be mistaken for the full structural trend.
For high-renewables power systems, weather is not external noise. It is the operating environment. The relevant question is not only how the system performs across the annual average, but how it performs in the bad sequence: cold, dark, low-wind, low-hydro, high-demand, high-price conditions.
Storage is where solar volume becomes system value
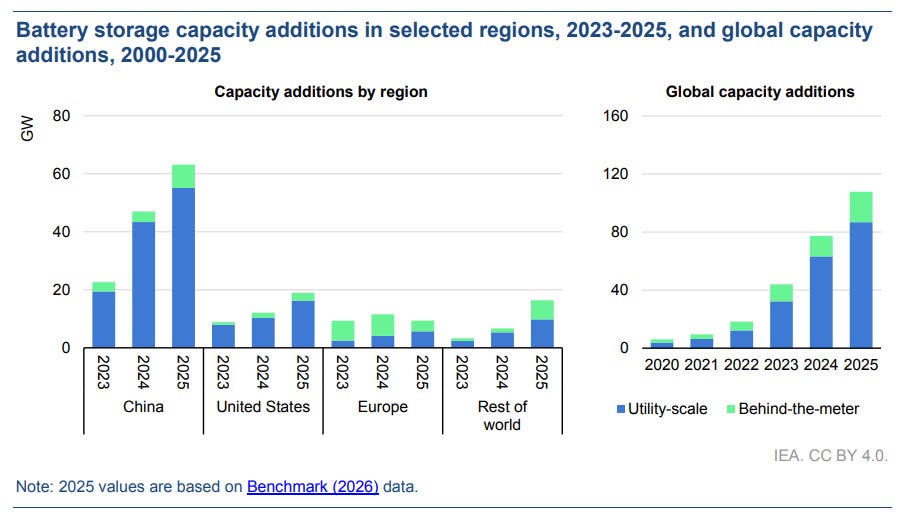
Battery storage is one of the most important system signals in the report. The IEA says battery storage was the fastest-growing power technology in 2025, with around 108 GW of new capacity deployed, up 40% from 2024. Installed capacity is now eleven times higher than in 2021, and around 80% of new battery capacity was utility-scale.
This matters because storage is the bridge between solar abundance and system usefulness. As solar penetration rises, the problem shifts from producing electricity to shifting it, storing it, pricing it and delivering it when it has value.
This is where deployment charts meet market design. Solar can depress its own capture price if too much output arrives at the same time. Storage can defend value by shifting output, reducing curtailment, relieving congestion and providing ancillary services. The more solar succeeds, the less optional flexibility becomes.
The investment question therefore moves from “what is growing?” to “what becomes scarce after growth?” If solar modules are abundant, the scarce assets are the ones that make solar useful: batteries, grid access, interconnection, flexible demand, firm capacity and market rules that reward availability when it matters.
Nuclear is back in the conversation before it is back in construction
Nuclear generation reached a record high in 2025, but the construction picture is much more concentrated than the rhetoric suggests. The IEA says 3 GW of new nuclear capacity came online, offset by 3 GW of retirements, leaving global nuclear capacity at around 420 GW. It also notes that construction started on 12.2 GW of nuclear capacity in 2025, with nine starts in China and one in Russia.
That does not make nuclear irrelevant. It makes delivery the central question. Nuclear is strategically attractive because it can provide firm low-carbon power, but in many Western markets the gap between policy enthusiasm and actual construction remains large. Respectability has improved faster than build rates.
The point is not to dismiss nuclear. It is to avoid treating rhetorical revival as capacity delivery. Energy systems are not decarbonised by conference panels. They are decarbonised by assets that are financed, permitted, built, connected and operated.
The real conclusion: from abundance to scarcity
The IEA review gives the abundance story: record solar, record renewable capacity additions, fast battery growth, rising electrification and meaningful avoided fossil demand relative to counterfactual baselines. That story is real. But the more useful strategic reading is the scarcity story underneath it.
The next phase of the transition is less about proving that clean technologies can exist at scale. They already do. It is about the scarce things that determine whether scale becomes value: grids, land, permits, connections, flexibility, storage duration, firm capacity, planning consent, public tolerance and market designs that pay for reliability.
That is why the IEA review should not be read as either triumph or failure. It is a report about a transition that is materially advancing while becoming more operationally complicated. Clean energy is increasingly taking the margin. Fossil fuels still dominate parts of the base. Emissions are lower than they would likely have been without clean technology deployment, but they are not yet falling globally.
The bottleneck has moved. It is no longer just technology cost. It is system usefulness.
Source note
This article is based primarily on the IEA Global Energy Review 2026, with cross-checks from Ember’s Global Electricity Review 2026 and the Global Carbon Project’s 2025 carbon-budget release.